error in delta discussion - CID A2003, Q5(ii)(c)??

Discussion in 'SP6' started by Gareth, Mar 7, 2006.

  1. Gareth

    Gareth Member

    This bit of the question is discussing how delta for a put changes as you get closer to expiry:

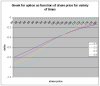
    "Term decreases: The magnitude of the Put option delta varies as time progresses and the time to expiration of the option reduces, whilst always remaining negative. When the option is at or out of the money, the magnitude of the delta will tend to increase as the option expires. If the option is deeply in the money, then the magnitude of the delta can decrease as time progresses, although close to maturity it may still increase. (A plot of magnitude of delta against time may have a turning point.)"

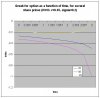
    Let's look at the graph of delta for a put:

    [​IMG]

    (see wilmott page 368 to verify this graph is correct)

    Out of the money means S > K (so that max(K-S,0)=0). This means we are on the right side of the graph. Notice that delta gets smaller in magnitude (i.e. closer to 0) as we get closer to expiry... (expiry here is t=1, so t=0.9 is close).

    Ok, so to be in the money, we need S < K. We are on the left. Here we can see that delta gets closer to -1 as time progresses. Again this is the opposate to what the examiner says.

    So is the answer wrong, or do i have a misunderstanding here?
     

    Attached Files:

    Last edited by a moderator: Mar 14, 2006
  2. ChrisR

    ChrisR Member

    The answer is correct - although it takes some odd circumstances (dividend yield in excess of the risk free rate). I've attached a screenshot from DerivaGem to demonstrate, which hopefully will work - although I'm not really au-fait with these message board things so you may have to bear with me.

    Your analysis of the behaviour close to expiry was correct - the odd behaviour is exhibited further away from expiry.

    C
     

    Attached Files:

    Last edited by a moderator: Mar 14, 2006
  3. Gareth

    Gareth Member

    i think it's still not so clear, consider the attached graph, showing delta changing with time, for variety of shares prices.

    The conclusion I reach is that the delta will grow in magnitude as the options
    expires if:

    a) put is in the money; or
    b) put is at the money.

    If the put is out of the money, then delta will decrease in magnitude as
    option expires.

    I can't see how the examiner's claim can be correct, since the examiner
    states:

    " When the option is at or out of the money, the magnitude of the delta will
    tend to increase as the option expires."

    which conflicts with b) above.

    But then as you say, if you pick some really weird circumstances like q > r, it could be so...although the question tells us to use the parameters underlying the attached graph, which seems to demonstrate the examiner was wrong...
     

    Attached Files:

  4. mtm

    mtm Member

    Question 5 was used directly by ACTED in Q&A 4.13. Part of the question 5 solution in the examiner’s report is incorrect. In this paper alone questions 4 and 5 had errors in the solutions. This seems to be an ongoing theme throughout the CID (and ST6!) examiners reports from 2000 to date (even the CID solutions specimen paper of April 1999 had errors). The examiner(s) quite plainly does not understand some of the principles underlying derivatives or is too lazy to make a second check of the solutions. (Do the examiners not get paid enough for them to bother making sure that the examiner’s report that gets put on to the web is correct in all aspects?). And the other obvious question that arises is what solution do the actuaries marking the exams look at when marking our papers?

    Thank goodness the solutions for question 5 were done afresh by ACTED staff.

    Consider (ii) (b) where the “portfolio of assets that delta hedges the investor’s option position” is asked for. According to Acted solutions this is just to short sell 414 shares. The examiner report also gives this but then goes on to “balancing its balance sheet”. I’m not too sure if I had to go on and give this second part as well but I am more comfortable with Acted’s solution. Any comments? See 109 Question 8, September 2004 for a B/S question where at the end they ask for a replication portfolio consisting of cash and stock – is this what the examiner is doing in the second part of question 5 (ii) (b)?

    Acted’s solution for 5 (ii) (c) agrees with Gareth’s solution. The question is specific to a non-dividend paying put, so I don’t think one should consider (not normal) situations of q>r.

    Then the examiner gives an answer for (iii) (b) which is not correct according to Hull
    pg 349 (6th ed) nor is it correct to Acted’s solution. HF=HA*e(-RT*) not as the examiner puts it: HF=HA*e(RT*).

    I am struggling to draw the spreads and combinations (P/L vs St) with different terms to expiry as none of our notes nor Hull explains this. I see that a few past CID questions have covered this but I can’t learn from the solutions as the examiner’s solutions tend to be wrong. (See Gareth’s other post about question 4 of this paper). Is the best way to learn them by sitting down and using Excel or DerivaGem?
     
  5. Mike Lewry

    Mike Lewry Member

    Exploring spreads and combinations

    The DG151functions.xls spreadsheet that comes with Hull (6 ed) is pretty good for this. Function9 on the FunctionSpecs worksheet allows you to set up a portfolio of various derivatives and then to calculate the price, delta, gamma, etc of the portfolio. It is a fairly simple matter to set up an array of values at varying values of the underlying (or alternative variable) and then produce a graph of the results.

    I found this so fascinating, I even got up extra early this morning to play around with it (sad, I know) !
     
  6. ChrisR

    ChrisR Member

    In retrospect, perhaps "The answer is correct" was a bit of a strong assertion! I guess I wanted to demonstrate that there can, theoretically, be a turning point - the rest of the answer does seem to be quite fundamentally wrong...

    It's pretty clear that, regardless of the rates of interest and dividend etc, the following must be true:

    - if you are in the money then delta will tend to -1 from above (it will increase in magnitude)

    - if you are out of the money then delta will tend to 0 from below (it will decrease in magnitude)

    Now if you are at the money you have a very weird siutation, where delta appears to tend to -0.5...

    Formula for delta is: e^ -q(T-t) PHI(-d1)

    As T-t tends to zero, the d1 term actually tends to zero because log(S/K)=0. Hence in the limit you have delta being -PHI(0)=-0.5.

    Whether or not we have come to -0.5 from above or below depends entirely on the relative levels of r,q and SIGMA.

    Whilst algebraically interesting (?) I think we are at risk of digressing from the most important issue with ST6, namely abusing the examiners. Sorry, I mean passing the exam!

    C
     

Share This Page